This is the follow-up to our Custom Reports guide.
Our new report will use realtime visit data. To get it, our API method will use the Live.getLastVisitsDetails method:
public function getLastVisitsByBrowser($idSite, $period, $date, $segment = false)
{
    $data = \Piwik\API\Request::processRequest('Live.getLastVisitsDetails', array(
        'idSite' => $idSite,
        'period' => $period,
        'date' => $date,
        'segment' => $segment,
        'numLastVisitorsToFetch' => 100,
        'minTimestamp' => false,
        'flat' => false,
        'doNotFetchActions' => true
    ));
    $data->applyQueuedFilters();

    // TODO

    return false;
}
$data will be a DataTable instance that stores information about visits; each visit being a DataTable row.
Now that we've got a list of visits, let's think about what our report will look like. Our report will count the number of visits for each browser. So each row will have the browser name and the number of visits. It might look something like this:
label   | nb_visits
-------------------
Chrome  | 24
Firefox | 32
Safari  | 28
DataTable Column Names
It might look odd that we use label and nb_visits for our report's column names instead of just Browser and Visits. That's because reports served through the API should be easy to process by other applications. Using label, which is common to all Matomo (formerly Piwik) reports, means apps that use the API can easily tell which column describes the row without having to know the details of the report.
Eventually, before we display the report, these column names will be replaced with names that are more informative to human viewers.
To create the report, we'll go through every visit and increment the counter for the browser. The counter will be the nb_visits column.
Change the method to the following:
public function getLastVisitsByBrowser($idSite, $period, $date, $segment = false)
{
    $data = \Piwik\API\Request::processRequest('Live.getLastVisitsDetails', array(
        'idSite' => $idSite,
        'period' => $period,
        'date' => $date,
        'segment' => $segment,
        'numLastVisitorsToFetch' => 100,
        'minTimestamp' => false,
        'flat' => false,
        'doNotFetchActions' => true
    ));
    $data->applyQueuedFilters();

    // we could create a new instance by using new DataTable(),
    // but we would lose DataTable metadata, which can be useful.
    $result = $data->getEmptyClone($keepFilters = false);

    foreach ($data->getRows() as $visitRow) {
        $browserName = $visitRow->getColumn('browserName');

        // try and get the row in the result DataTable for the browser
        $browserRow = $result->getRowFromLabel($browserName);

        // if there is no row for this browser, create it
        if ($browserRow === false) {
            $result->addRowFromSimpleArray(array(
                'label'     => $browserName,
                'nb_visits' => 1
            ));
        } else { // if there is a row, increment the counter
            $counter = $browserRow->getColumn('nb_visits');
            $browserRow->setColumn('nb_visits', $counter + 1);
        }
    }

    return $result;
}
If you visit http://localhost/index.php?module=API&method=MyPlugin.getLastVisitsByBrowser&idSite=1&date=today&period=week you should see the new report!
Realtime Reports vs Archived Reports
This new API method directly accesses visit data. That is because the report is a real-time report. Most reports aren't in real-time because the amount of time it would take to process visit data would make the interface unusable.
Archived reports are calculated and cached during the Archiving Process. To learn more, read about Matomo's Data Model guide.
Now that we've defined a new report, we need to define how the report should be displayed. We'll do this by going back to the GetLastVisitsByBrowser class and modifying the configureView() method:
public function configureView(ViewDataTable $view)
{
    // The ViewDataTable must be configured so the display is perfect for the report.
    // We do this by modifying properties on the ViewDataTable::$config object.

    // Disable the 'Show All Columns' footer icon
    $view->config->show_table_all_columns = false;
    // The 'label' column will have 'Browser' as a title
    $view->config->addTranslation('label', 'Browser');

    $view->config->columns_to_display = array_merge(array('label'), $this->metrics);
}
As we will only display the number of visitors, and not the number of unique visitors or actions which Matomo assumes by default, we need to modify the supported metrics in the init() method of the report as follows:
$this->metrics = array('nb_visits');
The report should now look like this:
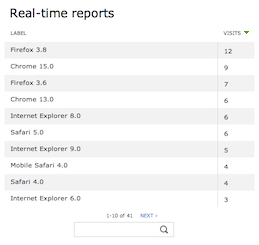
Report Visualizations
The ViewDataTable class outputs a report visualization. Report visualizations display an analytics report in some way. They can be in any format, for example HTML with JavaScript (like the default table visualization, or one of the graphs) or an image (like the sparkline visualization).
It is possible for plugins to create their own visualizations. To find out how, read our Visualizing Report Data guide (after you're done with this guide, of course).
So now there's a page with a report that shows the browsers used by the latest visitors. It uses realtime data - but it's not truly realtime since after a couple of minutes, the report will be out-of-date. To make the report more realtime we'll update the report every 10 seconds automatically.
To make the report reload itself, we'll have to write some JavaScript code. This means we'll need a JavaScript file.
Create an empty javascripts/plugin.js file in your plugin directory. Then register to the AssetManager.getJavaScriptFiles event (read more about Events) to have this javascript file included by Matomo:
class MyPlugin extends \Piwik\Plugin
{
    public function registerEvents()
    {
        return array(
            'AssetManager.getJavaScriptFiles' => 'getJavaScriptFiles',
        );
    }

    public function getJavaScriptFiles(&$files)
    {
        $files[] = 'plugins/MyPlugin/javascripts/plugin.js';
    }
}
Remember that Matomo will include this file directly only when disable_merged_assets is enabled in your ini config:
[Development]
disable_merged_assets = 1
If this option is disabled, Matomo will merge all JavaScript files into one to optimize the page loading time, but that means that any change to plugin.js will be ignored.
In your plugin.js file, add the following code:
$(document).ready(function () {

    setInterval(function () {

        // get the root element for our report
        var $dataTableRoot = $('.dataTable[data-report="MyPlugin.getLastVisitsByBrowser"]');

        // in the UI, the root element of a report has a JavaScript object associated to it.
        // we can use this object to reload the report.
        var dataTableInstance = $dataTableRoot.data('uiControlObject');

        // we want the table to be completely reset, so we'll reset some
        // query parameters then reload the report
        dataTableInstance.resetAllFilters();
        dataTableInstance.reloadAjaxDataTable();

    }, 10 * 1000);

});
As you can see, all our javascript code is inside the $(document).ready callback. This is because we want the JavaScript code to be executed when the page is fully loaded.
Now if you open the report in your browser, you'll see the report being reloaded every 10 seconds.